Dental care remains difficult to access for many Australians, even though oral disease is largely preventable or easier to manage when detected early. The latest Australian dental statistics show that 53.9% of people aged 15 and over visited a dental professional during 2024–25, while 25.2% of those needing care delayed or missed treatment. Cost was a barrier for 16.1%, showing why tooth pain, damaged teeth and gum problems are often left untreated until more involved care is required. Australia also spent $13.2 billion on dental services in 2023–24, with patients directly funding around 61% of the total.
The term Australian Dental Statistics 2026 refers to the latest evidence available in 2026. It does not mean that every statistic was collected during 2026. National health reports often combine recent expenditure records, registration data, patient surveys and older clinical oral-health studies. This article states the reporting period beside each major figure so readers can distinguish new findings from older clinical data.
Australian Dental Statistics 2026 at a Glance
The headline figures reveal three connected issues. Australians are using dental services more frequently than a decade ago, but almost half the population still does not report an annual visit. Financial barriers remain common, and patients fund a much larger share of dental expenditure than they do in many other areas of healthcare. At the same time, preventable dental conditions continue to place pressure on hospitals and families.
| Dental indicator | Latest reported figure | Data period |
| People aged 15+ who saw a dental professional | 53.9% | 2024–25 |
| People who delayed or missed needed dental care | 25.2% | 2024–25 |
| People who cited cost as a barrier | 16.1% | 2024–25 |
| Australian dental-services expenditure | $13.2 billion | 2023–24 |
| Spending paid directly by patients | Around $8 billion | 2023–24 |
| Patient-funded share of dental spending | 61% | 2023–24 |
| Potentially preventable dental hospitalisations | Nearly 88,600 | 2023–24 |
| Highest preventable hospitalisation rate | Children aged 5–9 | 2023–24 |
| Registered dental practitioners | 29,362 | December 2025 |
| Estimated dental-services industry revenue | $15.2 billion | 2026 commercial estimate |
| Estimated dental-services businesses | 20,919 | 2026 commercial estimate |
The attendance, affordability and expenditure figures come from the Australian Institute of Health and Welfare and Australian Bureau of Statistics. The registrant count comes from the Dental Board of Australia, while the 2026 industry revenue and business counts are commercial estimates rather than government health-expenditure figures.
Where Do Australia’s 2026 Dental Figures Come From?
Australian dental statistics are collected by several agencies because no single database records every private appointment, public clinic visit, diagnosis, treatment and payment. The Australian Institute of Health and Welfare, Australian Bureau of Statistics, Dental Board of Australia, Ahpra, Services Australia and Australian Prudential Regulation Authority all measure different parts of the oral healthcare sector.
What Is the Difference Between Government Data and Market Estimates?
Official health expenditure and commercial market revenue should not be treated as the same figure. The $13.2 billion AIHW total measures spending on Australian dental services in 2023–24. A commercial estimate of $15.2 billion for 2026 measures expected industry revenue using a different method and reporting year.
| Data type | What it measures | Example |
| Health expenditure | National spending on dental care | $13.2 billion in 2023–24 |
| Patient utilisation | Use of dental professionals | 53.9% attended in 2024–25 |
| Access barriers | Delayed or missed care | 25.2% in 2024–25 |
| Practitioner registration | People registered to practise | Dental Board quarterly data |
| Industry revenue | Commercial estimate of business income | $15.2 billion in 2026 |
| Clinical prevalence | Examined tooth decay or gum disease | Survey-specific findings |
Commercial research can help explain dental business activity, but government statistics are generally more suitable for public-health claims. Market projections, crown-placement estimates and future growth rates should always be labelled as estimates.
What Are the Main Limitations of Australian Dental Data?
Australia does not yet have a comprehensive national dataset covering all public and private dental activity. AIHW therefore combines national surveys, insurance records, hospital data, government-program records and workforce statistics. Different sources may cover different ages, reporting periods and definitions.
Important limitations include:
Some oral-disease figures come from older clinical surveys.
Patient surveys rely on people accurately recalling their experiences.
Private-practice treatment volumes are not fully visible in public datasets.
A reported dental visit may involve a dentist, hygienist or dental specialist.
- Registered practitioner numbers do not equal full-time clinical capacity.
- National averages may hide large differences between communities.
- Commercial forecasts depend on assumptions about future demand.
These limitations do not make the data unhelpful. They show why each statistic needs a date, definition and source.
What Do the Statistics Reveal About Australians’ Oral Health?
Tooth decay, gum disease and tooth loss remain the main oral-health problems affecting Australian children and adults. Their effects extend beyond the mouth. Pain, infection, difficulty chewing, disrupted sleep and reduced confidence can affect nutrition, communication, school attendance, work and general wellbeing.
Tooth Decay and Untreated Dental Caries
Dental caries develops when acids produced by plaque bacteria repeatedly remove minerals from tooth enamel. Frequent exposure to sugary foods and drinks can increase this process. Early mineral loss may sometimes be managed before a cavity forms, but an established cavity usually needs professional treatment. AIHW’s national summary reports that 27% of children aged 5–10 had untreated decay in their primary teeth based on 2012–14 clinical data. Among children aged 6–14, 11% had untreated decay in permanent teeth. For adults aged 15 and over, 32% had untreated decay based on the 2017–18 National Study of Adult Oral Health. These figures are valuable but should not be described as newly collected 2026 prevalence data.
Dentists and researchers often describe decay experience through the dmft or DMFT index:
- D means decayed teeth.
- M means teeth missing because of decay.
- F means filled teeth.
- Lowercase dmft refers to primary teeth.
- Uppercase DMFT refers to permanent teeth.
A high DMFT score does not necessarily mean every tooth currently has active decay. It records a person’s accumulated experience of decay, fillings and teeth lost because of disease.
Gum Disease, Tooth Loss and Oral Function
Gingivitis is the early inflammation of the gums and may cause redness, swelling or bleeding during brushing. Periodontitis is a deeper condition that affects the tissues and bone supporting the teeth. Without suitable care, periodontal disease may contribute to gum recession, loose teeth and eventual tooth loss.
Age alone does not cause gum disease, but the risk can rise as exposure accumulates. Smoking, diabetes, plaque build-up, dry mouth, irregular dental attendance, and difficulty cleaning between teeth may also affect periodontal health. A dental examination can assess bleeding, pocket depth, recession, tooth movement, and bone levels where appropriate.
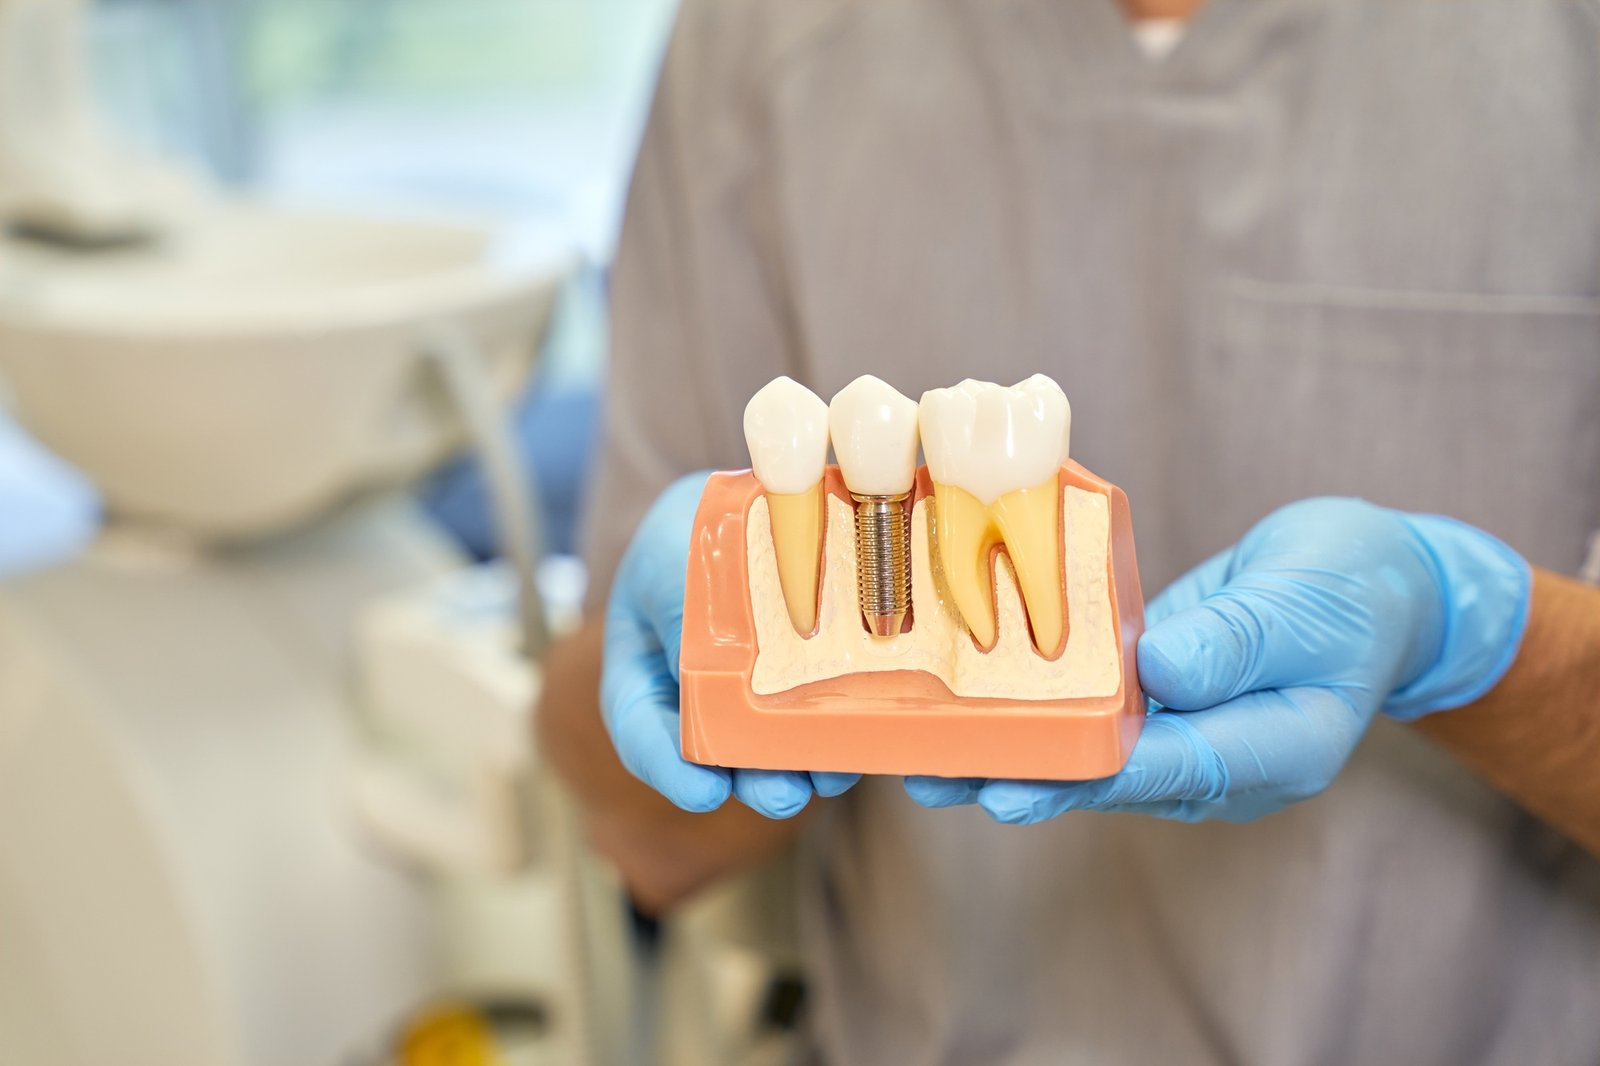
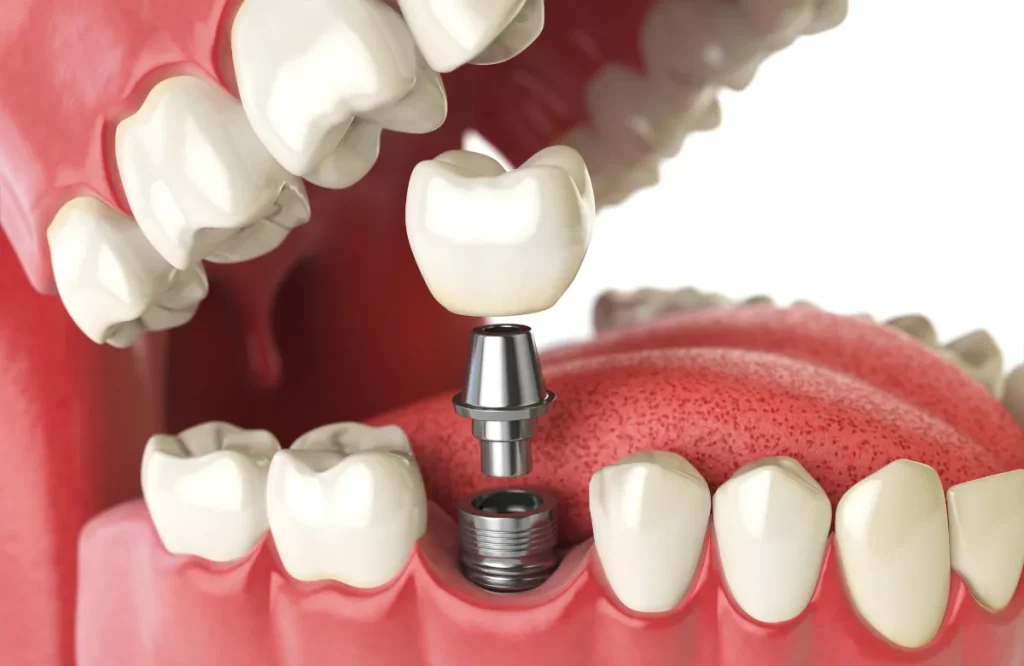
Tooth loss can affect much more than appearance. Missing teeth may change chewing efficiency, food choice, speech, bite balance, and confidence. Replacement options can include a removable denture, dental bridge, or dental implant, depending on oral health, bone support, medical history, and personal preferences.
Children’s Oral Health and Preventable Hospitalisations
Children aged 5–9 recorded the highest rate of potentially preventable dental hospitalisation in 2023–24, at 12.1 admissions per 1,000 population. Across all age groups, Australia recorded close to 88,600 hospitalisations for dental conditions that may have been prevented through earlier care.
Young children may require hospital treatment when extensive decay, infection, dental trauma, treatment needs or behavioural factors make care under general anaesthesia necessary. The hospitalisation itself treats the immediate problem, but it does not remove the need for ongoing brushing, dietary control and regular professional care.
Earlier national child data also found that 57% of children aged 5–14 had their first dental visit before age five, while 11% had never visited a dental provider. Children in higher-income households were more likely to have attended for a check-up rather than a dental problem, showing how family circumstances can shape preventive attendance.
How Are Australians Using Dental Services?
Dental utilisation measures how often people attend and whether they can obtain care when needed. It does not tell us whether every visitor has healthy teeth or whether every non-attender has active disease. However, regular attendance creates opportunities to detect decay, gum disease, cracked teeth, failing restorations and other concerns before symptoms become severe.
Dental Visit Rates Across the Population
The ABS reported that 53.9% of Australians aged 15 and over saw a dental professional during 2024–25, compared with 53.2% in 2023–24. Women reported a higher attendance rate than men, at 57.6% compared with 50.0%.
Attendance also differed by age:
| Age group | Saw a dental professional in 2024–25 |
| 15–24 | 54.4% |
| 25–34 | 46.9% |
| 35–44 | 50.6% |
| 45–54 | 55.3% |
| 55–64 | 59.3% |
| 65–74 | 59.7% |
| 75–84 | 56.7% |
| 85+ | 49.4% |
Adults aged 25–34 had one of the lowest reported attendance rates. Cost, work commitments, family responsibilities and the absence of pain may all influence attendance, although national figures cannot prove why a specific age group attends less often.
Why Do Patients Postpone Dental Appointments?
One in four people who needed a dental professional delayed or did not use the service during 2024–25. The rate fell from 28.0% in 2023–24 to 25.2%, but it still represents a substantial access problem. Adults aged 25–34 were especially likely to postpone care, with 33.0% reporting delay or non-use compared with 9.3% of people aged 85 and over.
Common barriers can include:
- Treatment cost
- Difficulty obtaining a suitable appointment
- Long waiting periods
- Work or study commitments
- Caring responsibilities
- Transport or travel distance
- Fear of discomfort
- Dental anxiety or phobia
- Embarrassment about the condition of the teeth
- Belief that treatment is unnecessary without pain
Dental anxiety should not be dismissed as simple nervousness. A previous painful experience, fear of injections, loss of control or concern about judgement can cause years of avoidance. Clear explanations, agreed signals to pause treatment and staged care may help some patients feel more comfortable.
Preventive Care Versus Problem-Driven Treatment
A preventive visit may include an examination of the teeth and gums, professional cleaning where needed, review of existing fillings or crowns, appropriate X-rays and advice based on the patient’s risk factors. Problem-driven visits usually begin after pain, swelling, fracture or another symptom appears.
Waiting for pain can be risky because early decay and gum disease may cause few obvious symptoms. A small area of decay may later involve a larger part of the tooth. A minor crack may spread under repeated chewing force. Gingivitis may progress into deeper periodontal damage in susceptible patients. People in Burwood and Sydney’s Inner West can arrange a general dental check-up to assess their current oral health and discuss a suitable recall period. Check-up timing should be based on individual risk rather than one fixed schedule for every patient.
How Much Does Dental Care Cost in Australia?
Dental affordability is one of the strongest themes in the 2026 data. Australia spent $13.2 billion on dental services in 2023–24, but patients directly funded around $8 billion, equal to 61% of total spending. This high patient contribution helps explain why cost remains a common reason for delaying care.
National Dental Expenditure and Patient Contributions
Dental expenditure includes preventive, diagnostic, restorative, surgical and prosthodontic services provided through private practices, public clinics and other settings. Funding can come from patients, private health insurers, the Australian Government, state and territory governments, and other organisations.
The 61% patient-funded share should not be confused with private health-insurance premiums. It refers to money that patients paid directly for services. Insurance may cover part of a fee, but annual limits, waiting periods, exclusions, and fixed rebates can still leave a gap payment.
The national figures also show why “free dental care in Australia” is not a general description of the system. Some eligible people can access public programs or subsidies, but most adults using private dental care remain responsible for a significant part of their treatment costs.
Why Is There No Single Average Price for Dental Treatment?
Australia does not have one compulsory national fee for private dental procedures. The cost of a filling, crown, root canal, implant or full-arch reconstruction can differ greatly because the same treatment name may cover cases with very different clinical requirements.
The main pricing factors include:
- The tooth’s location and remaining structure
- The number of surfaces affected by decay
- Infection or root canal involvement
- Crown or restoration material
- Dental laboratory fees
- X-rays or three-dimensional imaging
- Temporary restorations
- Core build-up requirements
- Bone grafting or gum treatment
- Number and length of appointments
- Sedation needs
- Specialist involvement
- Long-term maintenance requirements
For this reason, an online figure such as “average dental crown cost” should be treated as a broad guide rather than a quotation. A crown for a heavily damaged molar after root canal treatment may involve different work from a crown placed on a front tooth for functional and aesthetic reasons. A written treatment plan should state the recommended procedures, relevant dental item numbers, likely fees and available alternatives. Burwood Diamond Dental provides payment options that patients can discuss after receiving a clinical assessment and cost estimate.
What Do Medicare, CDBS and Private Health Insurance Cover?
Medicare does not cover most routine dental services. Public dental programs are administered through states and territories, and eligibility can depend on concession status, age, clinical urgency and local rules. Private health insurance may contribute under general dental or major dental extras, but coverage depends on the policy.
The Child Dental Benefits Schedule provides eligible children aged 0–17 with up to $1,158 over two consecutive calendar years in 2026. Covered services can include examinations, X-rays, cleaning, fissure sealing, fillings, root canal treatment, extractions and partial dentures. Orthodontic and cosmetic treatment are excluded.
Before treatment, patients should ask:
- Which item numbers are proposed?
- Is the service classed as general or major dental?
- Does a waiting period apply?
- What is the annual policy limit?
- How much has already been claimed?
- Will there be a gap payment?
- Are review visits included in the quoted fee?
How Large Is the Australian Dental Industry?
Australia’s dental-services industry includes independent practices, group practices, corporate dental providers, public clinics, hospitals, dental laboratories, specialists and allied oral-health professionals. Its size reflects population growth, preventive demand, restorative needs, cosmetic treatment and the growing number of older Australians retaining natural teeth.
Dental-Services Market Size and Business Activity
IBISWorld estimates that Australian dental-services businesses will generate approximately $15.2 billion in revenue during 2026 across 20,919 businesses. These figures are commercial estimates and should not replace the official AIHW expenditure total of $13.2 billion for 2023–24. The values differ because they cover different periods and use different measurement methods.
The industry contains:
- Independent private dental practices
- Multi-location dental groups
- Corporate dental clinic operators
- Public dental clinics
- Specialist practices
- Dental laboratories
- University teaching clinics
- Hospital dental departments
- Mobile and regional dental services
Practice growth does not automatically mean equal access. A large share of dental businesses may operate in metropolitan areas, while communities outside major cities can still face travel and appointment barriers.
Australia’s Dental Workforce
The Dental Board of Australia reported 29,362 registered dental practitioners at December 2025, representing 2.4% growth from December 2024. Of these, 26,042 held general registration, while other registrants held general and specialist, specialist-only, limited or non-practising registration. Women represented 57.4% of registrants.
The registered dental workforce includes:
- Dentists
- Dental specialists
- Dental hygienists
- Dental therapists
- Oral health therapists
- Dental prosthetists
Registration count is different from service capacity. Some professionals work part-time, hold non-practising registration, divide their hours between teaching and clinical work, or practise in areas with different levels of demand. The Dental Board publishes quarterly registration tables to track changes by profession, registration type, sex, age and location.
What Is Driving Demand for Dental Services?
Australia’s ageing population is one important demand factor. Eighteen per cent of Australians were aged 65 or over in 2024–25, and that share is projected to reach 24% by 2065–66. Older adults are also retaining more natural teeth, which means they may need ongoing care for root decay, gum disease, worn teeth, old restorations, dry mouth and tooth replacement.
Other demand drivers include:
- Population growth
- Greater awareness of preventive care
- More adults retaining natural teeth
- Demand for dental implants
- Need for crowns and restorative dentistry
- Clear aligner treatment
- Cosmetic dental care
- Digital scanning and restoration workflows
- Increased management of chronic health conditions
- Delayed treatment becoming more involved
Demand is therefore shaped by both positive behaviour, such as preventive attendance, and negative pressures, such as untreated disease and affordability barriers.
Where Are Australia’s Biggest Dental Access Gaps?
National averages can hide large differences between households and locations. The latest ABS data shows that socioeconomic disadvantage and remoteness are closely associated with lower dental attendance and higher rates of delayed care.
Socioeconomic Differences in Dental Attendance
In 2024–25, 64.9% of people living in the least disadvantaged areas saw a dental professional, compared with 42.1% in the most disadvantaged areas. People in the most disadvantaged areas were also more likely to delay or miss care because of cost: 23.1% compared with 9.6% in the least disadvantaged areas.
These gaps can create a cycle:
- Preventive visits are postponed.
- Early disease remains undetected.
- Pain or infection develops.
- Treatment becomes more involved.
- The higher expected cost causes further delay.
- Emergency or extraction-based care becomes more likely.
Affordability is therefore more than a payment issue. It can affect the timing, type and long-term outcome of dental treatment.
Rural and Remote Dental Access
People living in major cities reported a dental attendance rate of 55.9%, compared with 45.5% among people in outer regional or remote areas. They were also less likely to delay care and less likely to cite cost as a barrier.
Regional access can be affected by:
- Fewer dental practitioners per resident
- Longer travel distances
- Limited specialist services
- Reduced public-clinic capacity
- Fewer appointment choices
- Dependence on visiting providers
- Higher travel and accommodation costs
- Difficulty returning for review appointments
Telehealth may support initial discussion, triage or follow-up in selected cases, but it cannot replace a physical examination, dental X-rays or hands-on treatment.
Communities With Additional Oral-Healthcare Needs
First Nations people, people with disability, residential aged-care residents, people with chronic health conditions and people requiring communication support may face added barriers. These can include transport, inaccessible facilities, carer availability, sensory needs, language differences, medical risk and limited access to clinicians with suitable experience.
Fair access may require:
- Wheelchair-accessible treatment spaces
- Longer appointments
- Interpreter or communication support
- Culturally safe care
- Coordination with medical practitioners
- Carer involvement
- Sedation assessment
- Hospital referral in selected cases
- Clear written home-care instructions
Providing the same appointment format to every patient does not always produce equal access. Clinical care may need to account for a patient’s health, mobility, communication and support requirements.
Key Findings From Australian Dental Statistics 2026
Australian dental attendance has improved over the longer term, but almost half of people aged 15 and over still did not report an annual visit in 2024–25. One-quarter of those needing care delayed or missed it, with cost creating the greatest burden for disadvantaged and regional communities. Patients directly funded 61% of Australia’s $13.2 billion dental expenditure, while preventable dental conditions produced nearly 88,600 hospitalisations. The dental workforce and services industry continue to grow, yet practitioner distribution and affordability remain uneven. For patients, early assessment, clear cost information and informed treatment planning can reduce the risk of a manageable concern becoming a painful or more involved dental problem.
References
Australian Institute of Health and Welfare — Australia’s Health 2026
https://www.aihw.gov.au/reports/australias-health/australias-health-2026/contents/key-findings
Australian Bureau of Statistics — Patient Experiences, 2024–25
https://www.abs.gov.au/statistics/health/health-services/patient-experiences/latest-release
Australian Institute of Health and Welfare — Oral Health and Dental Care in Australia
Dental Board of Australia — Registration Statistics
https://www.dentalboard.gov.au/About-the-Board/Statistics.aspx
Australian Government Department of Health, Disability and Ageing — Dental Health